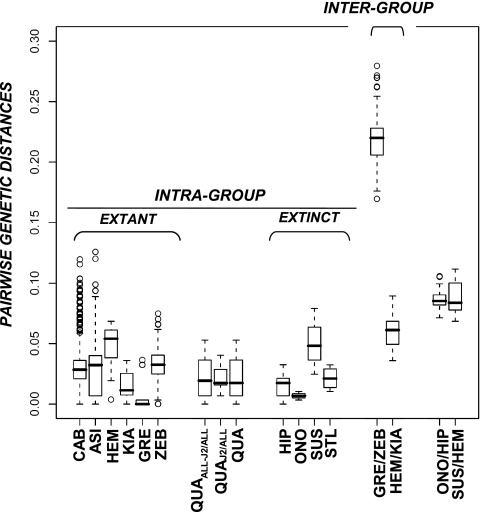
Fig. 2.
Intra- and interspecific corrected (GTR+Γ+I) pairwise distances among equids. The dataset consisted of 1,544 sequences encompassing positions 15518 and 15818 from the complete horse mitochondrial genome (GenBank accession no. X79547). Numeric values are reported on Table S3A. A complete list of accession numbers used for defining each taxonomic group is provided as SI Text. Parameters and distances were estimated using PhyML 3.0 and PAUP* 4.0, respectively. Bar, median; box, 50% quantiles; bars, 75% quantiles; CAB, E. caballus; ASI, E. asinus; QUA, E. quagga (all Plain zebras, including E. quagga quagga); QUAJ2, node J2 is defined on Fig. 1 and includes samples ACAD226 and ACAD230; QUAALL-J2, QUA but excluding samples for node J2; GRE, E. grevyi; ZEB, E. hartmannae; HEM, E. hemionus; KIA, E. kiang; HIP, Hippidion saldiasi/principale; ONO, Hippidion devillei (Peruvian hippidions; ACAD3615, ACAD3625, ACAD3627, ACAD3628, and ACAD3629); STL, New World Stilt-Legged horses; SUS, Sussemiones (Khakassia, SW Siberia; ACAD2302, ACAD2303, and ACAD2305). Only two distributions (GRE/ZEB and HEM/KIA) are shown for the intergroup genetic distances, given that all others are included within these two.

