Fig. 2.
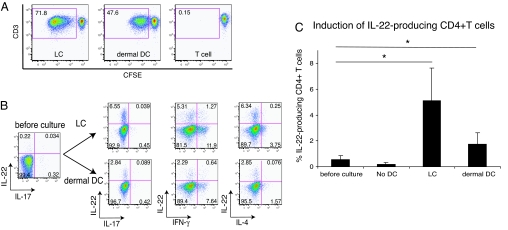
LCs and dermal DCs activate CD4+ T cells, leading to cell proliferation and IL-22 production. (A) Allogeneic whole peripheral T cells were labeled with CFSE and cultured for 7 days with sorted LCs or dermal DCs. Proliferation was determined by the dilution of CFSE analyzed by flow cytometry. Live, CD4+ cells were first gated and then plotted as CFSE vs. CD3. Percentage of live, proliferating CD4+ T cells is indicated in gate. Data are representative of four independent experiments. (B) Intracellular IL-22 vs. IL-17, IFN-γ, and IL-4 detected in proliferating CD4+ T cell population following 7-day coculture of whole peripheral T cells and sorted allogeneic LCs or dermal DCs. T cells stimulated by LCs or dermal DCs were restimulated with PMA and ionomycin in the presence of BFA for 4 h and subsequently analyzed for the production of indicated cytokines by flow cytometry. Live, CD4+ proliferating T cells were first gated and then cytokine production profile was analyzed. Numbers in quadrants indicate percentage of gated cells in each. Data are representative of six independent experiments. (C) Frequency of the cells producing IL-22 among CD4+ T cells before culture and that among proliferating CD4+ T cells after 7-day MLR assay. Horizontal axis indicates stimulators of T cells, and “No DC” group represents T cells cultured for 7 days without DCs. Asterisks (*) indicate statistical significance (P < 0.05). Data represent the mean (±SD) of six independent experiments.

