Fig. 3.
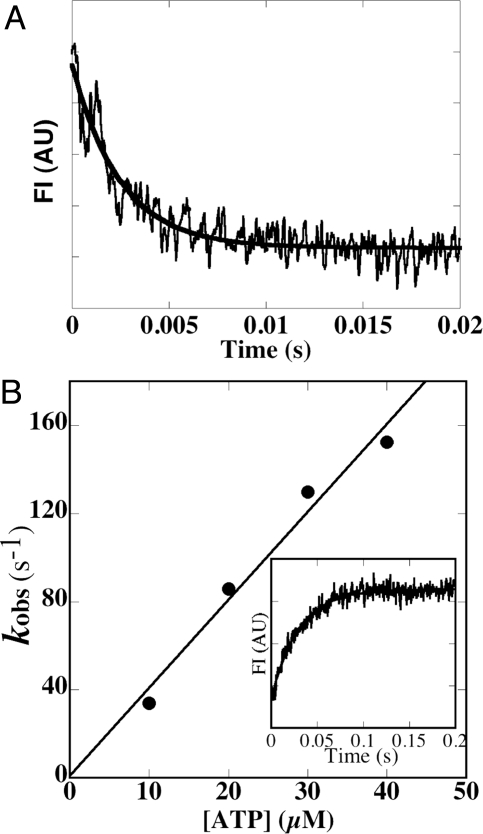
Kinetic analysis of acto-L2 (+4). (A) MantADP dissociation from acto-L2 (+4). A solution containing 1 μM L2 (+4), 20 μM actin and 100 μM mantADP was mixed with 5 mM ATP (final concentration) at 25 °C. MantADP dissociation from acto-MD was monitored using fluorescence energy transfer between tryptophan of motor domain and mantADP. The transient is an average of 5 to 7 separate recordings and the solid line is a single exponential fit, which gave a rate constant (k-ADP) of 406 s−1 in the example shown. Averaged value of 5 independent assays for 2 independent preparations was 480 ± 70 s−1 (n = 5). AU = arbitrary units. (B) ATP-induced dissociation of the pyrene-actin- L2 (+4) complex. Observed rate of ATP-induced dissociation (kobs) at 25 °C was plotted against ATP concentrations (10 to 40 μM). Slope of the plot gave a value for K1k+2 of 4.0 μM−1s−1. (Inset) Representative data when 0.5 μM pyrene-acto- L2 (+4) complex was mixed with 10 μM ATP (final concentration). Single exponential fit to the observed fluorescence change gave a rate constant of 34 s−1 (solid line).

