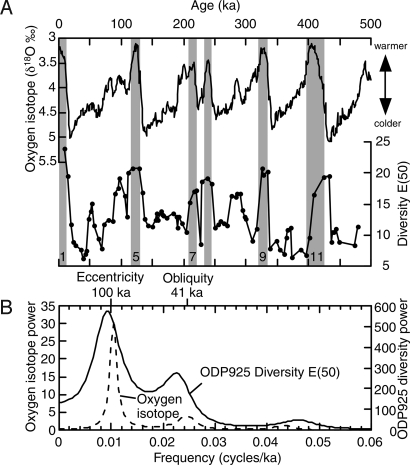
Fig. 2.
Late Quaternary tropical deep-sea diversity changes. (A) Comparison between deep-sea oxygen isotope curve [LR04 global stack (37)] and ODP 925 ostracod species diversity E (50). The oxygen isotope curve represents global climate changes, and the lower isotope values indicate warmer (interglacial and interstadial) intervals. Major interglacial and interstadial peaks are highlighted by gray bars. Peak interglacial marine isotope stages are labeled. (B) Result of spectral analysis.

