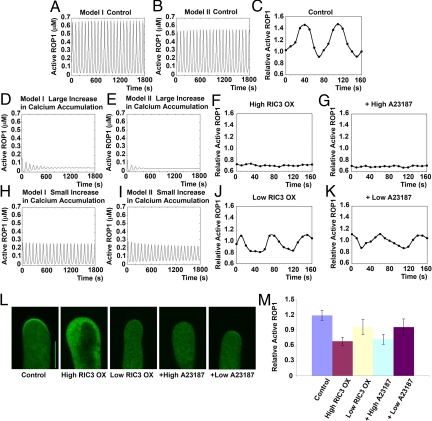
Fig. 4.
Simulation and experimental validation of the effect of calcium on ROP1 activity oscillation. (A and B) Simulation of ROP1 activity oscillation in control pollen tubes using model I (A) and model II (B). (C) Experimental measurement of ROP1 activity oscillation in control pollen tubes. Relative ROP1 activity was measured as described in Fig. 3. Shown is a typical oscillating pollen tube with an amplitude of 0.5 (from 0.9 to 1.4) and a period of ≈80 s. (D and E) Simulations from both models I and II predicted that apical ROP1 activity would remain low and lose oscillation in pollen tubes, in which the calcium accumulation rate is greatly increased. For both models, βy = 0.75 s−1. (F) Time-course analysis of the relative ROP1 activity in a pollen tube expressing a high level of RIC3. Here 0.1 μg of RIC3 plasmid DNA was used for transformation. Shown is a representative of 30 tubes examined, all of which exhibited low and nonoscillating relative ROP1 activity (< 0.8). (G) Time-course analysis of relative ROP1 activity in a pollen tube treated with 1 μM A23187 ionophore (high A23187). Shown is a representative of 20 tubes examined, all of which exhibited low and nonoscillating relative ROP1 activity (< 0.8). (H and I) Simulations from both models I and II predicted that apical ROP1 activity could maintain oscillation but with much smaller amplitudes in pollen tubes with a moderately increased calcium accumulation rate. For model I, βy = 0.5 s−1. For model II, βy = 0.4 s−1. (J) Time-course analysis of relative ROP1 activity in a pollen tube expressing a low level of RIC3. Here 0.02 μg of RIC3 was used for transformation. Relative ROP1 activity oscillates with similar periods but smaller amplitudes (0.3, from 0.8 to 1.1) compared with control tubes. Shown is a representative of 5 tubes examined that exhibited a similar pattern. (K) Time-course analysis of relative ROP1 activity in a pollen tube treated with 10 nM A23187 ionophore (low A23187). Relative ROP1 activity oscillated with similar period but smaller amplitude (0.2, from 0.9 to 1.1). Shown is a representative of 3 tubes examined that all exhibited a similar pattern. (L) Representative snapshot images of GFP-RIC4ΔC localization in various treated tubes. (Scale bar: 10 μm.) (M) Quantitative analysis of relative ROP1 activity in various treated pollen tubes. Shown is mean relative ROP1 activity measured from snapshot images (n = 20; P < .05, Student t-test). Error bars indicate SD.

