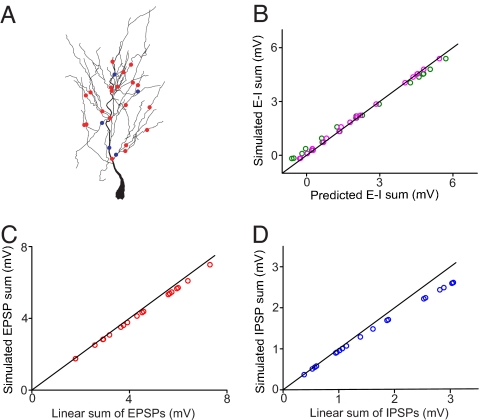
Fig. 6.
Integration of multiple Es and Is. (A) Distribution of 20 Es (red dots) and 5 Is (blue dots) at the dendritic arbor of the model neuron. (B) Comparison between the simulated response and the responses predicted by Eqs. 4 (green) and 5 (magenta). (C) Summation of the 20 coactivated Es with individual conductances ranging from 0.05 to 0.48 nS. (D) Summation of the five Is with individual conductances ranging from 0.32 to 6.40 nS.

