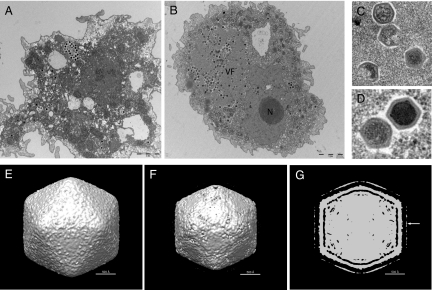
Fig. 1.
Ultrastructure of Marseillevirus. Transmission electron microscopy images were taken at 30 min p.i. (A) and at 6 h p.i. (B). (A) Marseillevirus particles being phagocytosed by an amoeba. (Scale bar: 2 μm.) (B) A virus factory (VF) developed through the cell cytoplasm, near the nucleus (N). (Scale bar: 2 μm.) (C) Different stages of Marseillevirus assembly. (D) Complete immature and mature virus particles. (E-G) Cryo-EM 3D reconstruction using images of purified Marseillevirus. (E) Shaded-surface representation of the Marseilles virus 3D density map at contour level σ = 0.5 viewed along an icosahedral twofold axis. (F) Same density map as (E) at a higher contour level (σ = 1.75). The density of the fibers is lower than that of the capsid and is not visible at this contour level. (G) A central sliced view of the Marseillevirus 3D density map at contour level σ = 1.2. Only the globular ends of the fibers are visible as an outer layer of density (white arrow). The stems of the fibers are not visible. However, the fibers can be seen in the original micrographs. The absence of the fibers in the reconstruction is a result of low resolution and/or the fibers being flexible.

