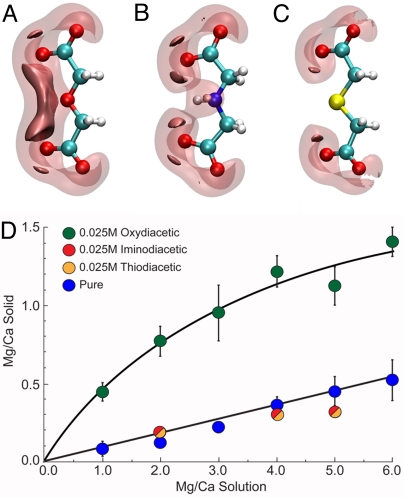
Fig. 3.
Isosurfaces of the negative electrostatic potential about (A) oxydiacetate (ODA), (B) iminodiacetate (IDA), and (C) thiodiacetate (TDA). The transparent and opaque surfaces are contoured at −0.35 and −0.40 a.u., respectively. (D) Measured Mg/Ca ratios of ACC formed in the presence of 0.025 M ODA, IDA, or TDA relative to the inorganic baseline.

