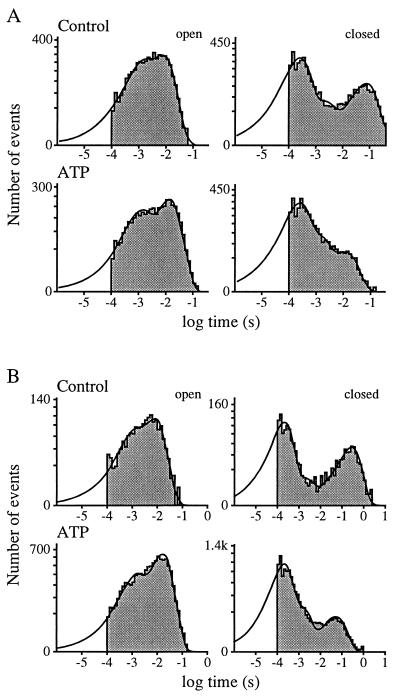
Figure 3.
Open and closed time histograms obtained for two cation channels before and after application of 1 mM ATP. The exponential fits used to determine the time constants are indicated by the superimposed curves (see Table 1 legend and Materials and Methods). (A) Histograms for the channel shown in Fig. 1 (Top traces). The average control Po was 0.16, and the average Po in ATP was 0.62. (B) Histograms for a channel that exhibited a smaller increase in Po in response to ATP than that observed for the channel in A. For this channel, the average control Po was 0.06 and the average Po in ATP was 0.11. Note that ATP affected the same parameters for both channels.

