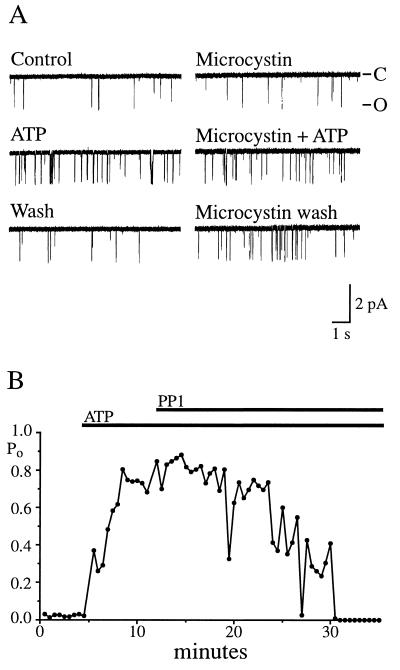
Figure 4.
Reversal of the effect of ATP. (A) Steady-state recordings of cation channels showing reversal of the effect of ATP after return of the patch to a zero-ATP, control intracellular solution (Left), and block of the reversal in the presence of 200 nM microcystin-LR (Right). Holding potential, −60 mV. (B) Time course of the change in Po observed during treatment with ATP (2 mM) and, subsequently, PP1 (22 nM). Each data point represents the average Po obtained for one 30-s interval. Application of ATP and PP1 is indicated by the bars at the top of the figure. The effect of ATP was noticeable almost immediately, although ≈4 min were required for the Po to stabilize at the new higher value. In response to PP1, which was applied in the continued presence of ATP, the Po oscillated for several minutes before a complete reversal.

