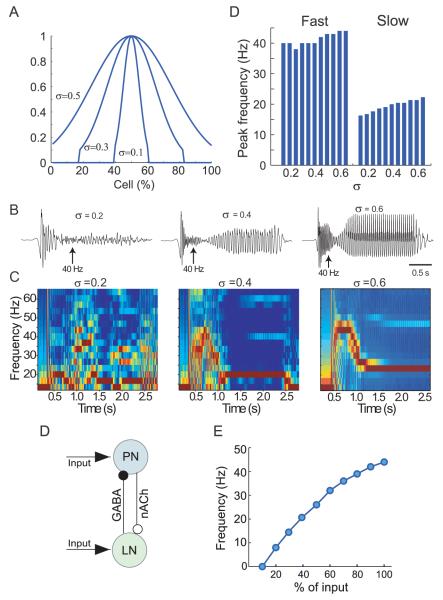
Figure 7. Effect of odor concentration upon LFP frequency in moth AL model.
(A) Odor input to the network was simulated by synaptic currents applied to an odor-specific population of PNs and LNs. The size of stimulated population (defined by a Gaussian distribution with width σ; see Figure 5K was varied to simulate different odor concentrations.
(B) Examples of LFP oscillations elicited by three odor concentrations. As in vivo, during lengthy odor stimuli the network shifted from fast to slow oscillatory states. LFP was band-pass filtered (5-50 Hz).
(C) Spectrograms of LFP oscillations (those shown in B) for three odor concentrations.
(D) Minimal network consisting of a single PN and LN.
(E) Frequency of oscillations in the minimal network increased sub-linearly as a function of input amplitude.

