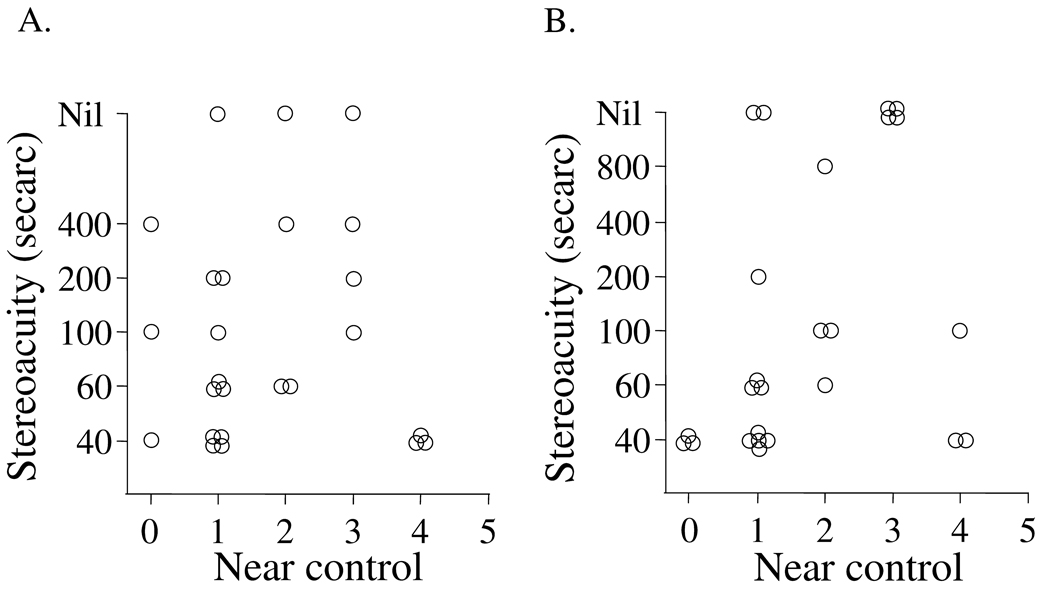
Figure 5.
Relationship between near control score and measurable near stereoacuity thresholds either measured using the near Frisby test (A) or the Preschool Randot® test (B). The performance on both tests was generally excellent, but the correlation with control score was poor with the near Frisby (rs= 0.02, p=0.9) and modest with the Preschool Randot® test (rs=0.4, p=0.04).

