Figure 1.
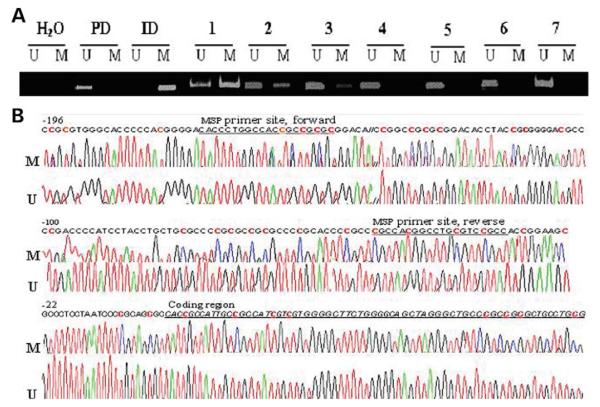
Representative examples of the MSP and sequence analyses of MB-COMT promoter. Brain samples from schizophrenia and bipolar disorder patients and control subjects were analyzed using MSP as outlined under Materials and Methods. (A) MSP: lanes U and M indicate the presence of unmethylated and methylated templates, respectively. Placental DNA (PD) and in vitro methylated DNA (ID) served as negative and positive controls, respectively. A no-template sample (H2O) was used to detect DNA contamination in the PCR reactions. Samples 1–3 indicate the presence of a methylated promoter DNA and samples 4–7 represent an unmethylated promoter. (B) Bisulfite sequencing of the MB-COMT promoter of an un-methylated template (sample 4) correlates with conversion of cytosine (C) to thymine (T) in the DNA sequence traces in the promoter region corresponding to CpGs (U). However, the samples exhibiting methylation (sample 1) contained sequence traces for Cs in addition to Ts at several CpGs (which include two SP1 binding sites), indicating that the template is a mixture of unmethylated and methylated DNA (M). The color codes for the nucleotides are as follows: red, thymine; green, adenine; black, guanine and blue, cytosine. The original DNA sequence is indicated at the top of the trace; red Cs are within CpG sequences and are targets for methylation.

