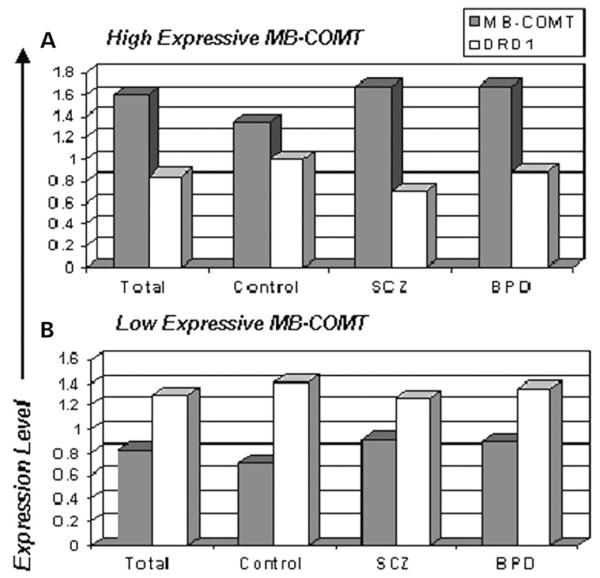
Figure 4.
Relationship between the expression of MB-COMTand DRD1. The upper (A) and lower (B) panels represent the gene expression profiles of high and low expressive MB-COMT groups, respectively, in total samples, control subjects, schizophrenia (SCZ) and bipolar disorder patients (BPD). As it is shown, when MB-COMT expression is high, the expression of DRD1is low and vice versa, both in control subjects and in the patient group implying that, in general, hyper-expression of MB-COMT is associated with hypo-expression of DRD1.

