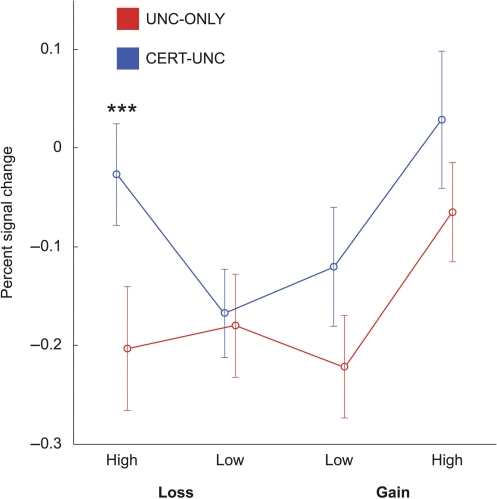
Fig. 2.
Percent signal change in NAcc. Points represent mean percent signal change from the experiment mean in bilateral NAcc at 4 s following cue onset. Error bars represent standard errors within participants. Only uncertain trials are shown, and only between-set differences for the same incentive are indicated. See Table 3 for data and all pairwise comparisons. ***P < 0.001.

