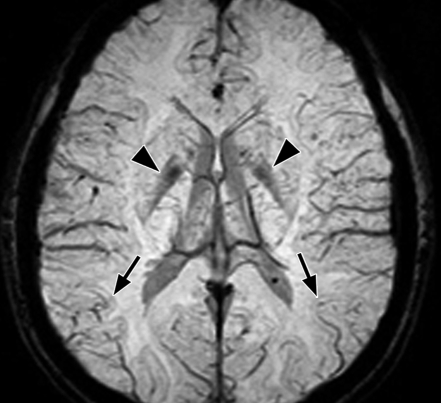
Figure 10d.
Axial SW MR images obtained at 3 T (20/30; flip angle, 15°; bandwidth, 100 Hz/pixel; voxel size, 0.5 × 1.0 × 2.0 mm; FOV, 256 × 256 mm). Original magnitude image (a), original phase image (b), processed single-section magnitude image (c), and minimum intensity projection through eight sections (d) show enhancement of the veins and globi pallidi (arrowheads in b–d), which are seen as dark structures. There is also increased visibility of cortical fibers connecting adjacent sulci (arcuate fibers) (arrows in b–d), especially on phase (b) and processed magnitude (c) images. The thick (16-mm) minimum intensity projection SW image (d) shows dark vessels, with increased depiction of small veins.

