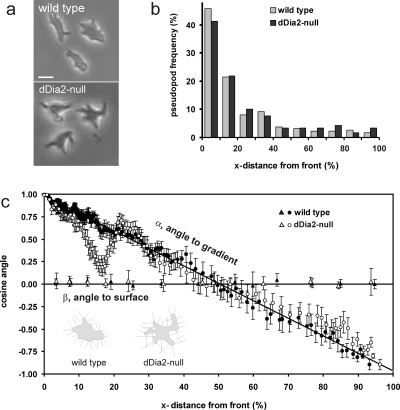
Figure 2. Reduced chemotaxis due to morphology changes in dDia2-null cells.
(a) shows the shape of representative spherical wild type cells and starlike dDia2-null cells; the cAMP source is at the left. (b) The number of pseudopodia that emerge at different distances from the front of the cell (x-distance, defined from front to rear of the cell). (c) The cosines of the angles α and β are presented as function of the x-distance from the front. For pseudopodia perpendicular to a circle, this will yield straight lines for α and β as drawn. To present the large dataset in an optimal way, the data were placed in an array with increasing values of x-distance. To calculate cos(α), gliding blocks of 15 adjacent data points were taken with increments of 5 data points (i.e. 1–15, 6–20, 11–25, etc.); the mean and SEM of these 15 data points are shown. The data for cos(β) are averaged for 5% or 10% intervals of the x-distance and presented as the mean and 3×SEM (the intervals are 5% for 0–30%, and 10% for 30–100%; 3×SEM to obtain error bars that are larger than the symbols). The total number of pseudopodia is 835 for wild type cells and 605 for dDia2-null cells (inset) (c) shows schematic drawings of two cells [redrawn from the cells at the right in (a)] with perpendicular lines to illustrate the effect of cell shape on the direction of pseudopod extension.

