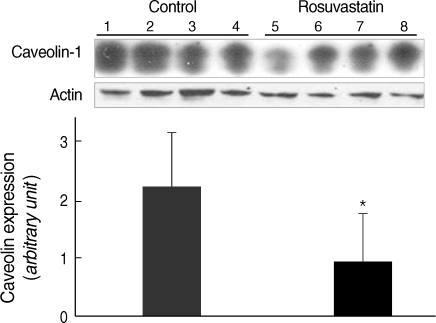
Fig. 4.
Assessment of the effect of rosuvastatin on caveolin-1 protein in the aorta of rats Top: Immunoblot of caveolin-1 protein in the aorta (lane 1, 2, 3, and 4, aorta from control SHR; lane 5, 6, 7, and 8, aorta from the rosuvastatin-treated SHR). Bottom: quantified data for caveolin-1 protein in rosuvastatin-treated and control SHRs. Optical density caveolin-1 positive bands were quantified by scanning densitometry and plotted relative to the control.
Column=mean values, error bar=standard error. *P<0.01 as compared to the control.

