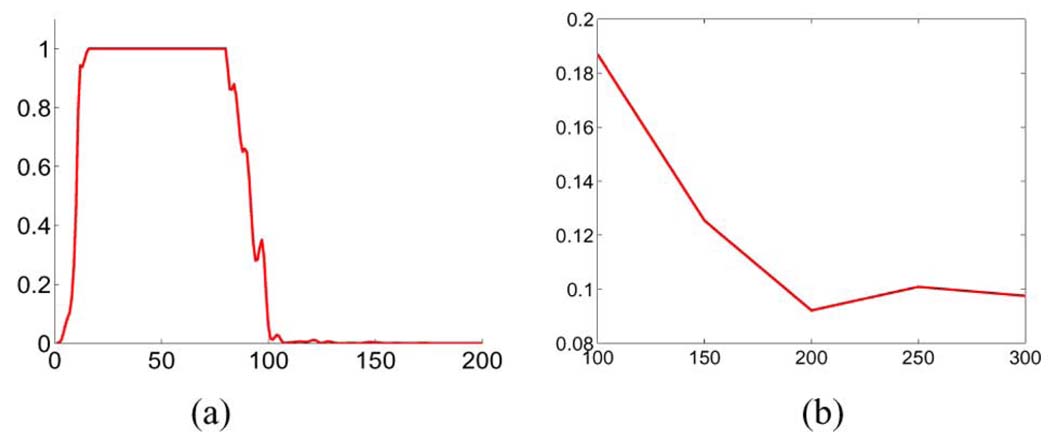
Fig. 6.
(a) Combined frequency response of the filters obtained when the combined frequency response cutoff is set to Lc = 100. Note the sharper cutoff obtained. However, this is at the expense of ringing. (b) Plot of ringing versus cutoff frequency Lc. Ringing is defined to be the ratio of the second peak to the maximum peak at the lowest scale, a = 4. (a) Combined frequency response, Lc = 100. (b) Ringing versus Lc.

