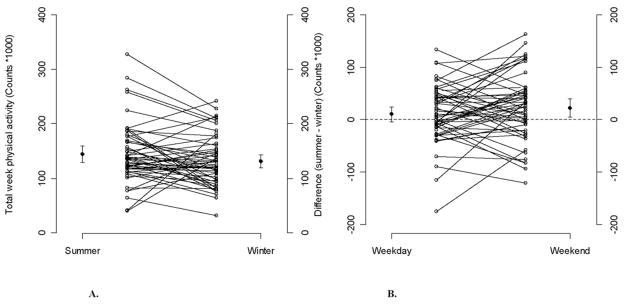
Figure 1.
Individual plots for total unadjusted physical activity(PA) (counts/d × 103) (A) during summer and winter; (B) difference in physical activity (counts/d × 103) between summer and winter during weekday and weekends along with the means and the corresponding 95% confidence intervals. Dots are the means of PA during summer or winter or the mean difference in PA between summer and winter, and bars represent the corresponding 95% confidence intervals.

