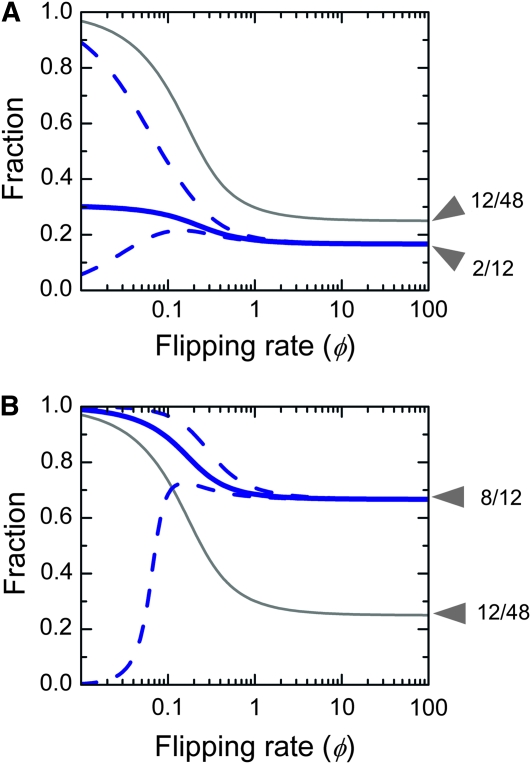
Figure 4.—
Phenotypic tuning. (A) Design 1: the robust core. (B) Design 2: disjoint islands. (A and B) The thin gray line shows the steady-state fraction λ(φ) of cells in the HNN compared to the total number of cells. The population as a whole increases exponentially with growth rate γL + (γH − γL)λ(φ) (Equation 4). For φ ≪ 1 almost all cells are in the HNN; for φ ≫ 1 the population spreads uniformly over the graph, so the chance of being in one of the 12 high-fitness states is simply 12/48. The thick blue line shows the steady-state fraction of S-expressing cells within the HNN, compared to all the cells within the HNN. For φ ≪ 1 cells preferentially populate S-expressing genotypes, but at φ ≫ 1 they spread uniformly over the HNN. The dashed blue lines indicate what happens when S expression influences fitness. The bottom line shows the result of a 10% growth rate decrease, and the top line shows the result of a 25% growth rate increase, relative to the (γH − γL) baseline. These changes have very little impact for large φ. As φ approaches zero, any growth rate increase or decrease, respectively, causes the S-expressing population to either dominate the population or completely vanish.

