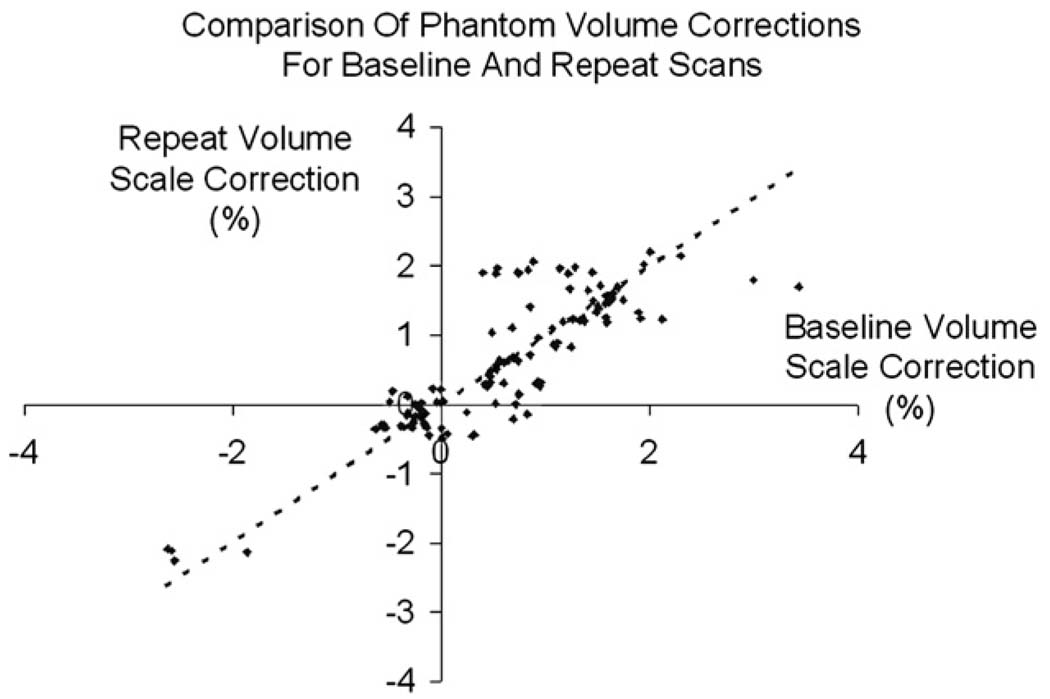
Fig. 1.
The baseline percentage volume correction (X-axis) against the corresponding repeat image percentage volume correction (Y-axis), calculated using the phantom correction procedure. Any points that lie off the y = x line represent where the phantom correction differed between baseline and follow-up—which should indicate the presence of a scaling change on the scanner between the two MRI exams.

