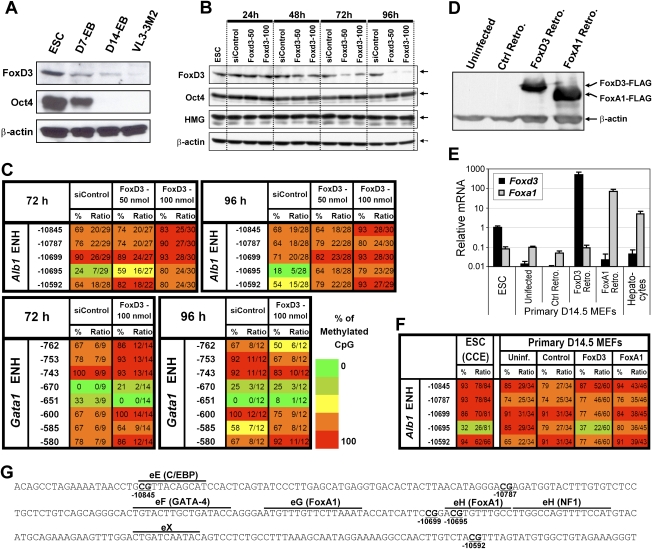
Figure 1.
FoxD3 regulates the Alb1 enhancer mark in ES cells. (A) FoxD3 and Oct4 protein levels were monitored by Western blot using whole-cell extracts prepared from CCE ES cells, day 7 and day 14 embryoid bodies (EBs), and VL3-3M2 thymocytes (as a negative control). β-Actin was analyzed as a loading control. (B) FoxD3 was depleted from ES cells transfected with 50 or 100 nmol of a Foxd3 siRNA pool (Dharmacon). In parallel experiments, ES cells were transfected with a nontargeting control siRNA pool (siControl; Dharmacon). At four time points after transfection, knockdown efficiency was monitored by Western blot using FoxD3 and Oct4 antibodies. HMG1 and β-actin were analyzed as controls. (C) Methylation state of the Alb1 enhancer was monitored by bisulfite sequencing. A region of a Gata1 enhancer that also contains unmethylated CpGs in ES cells was monitored as a control. Results are shown for DNA isolated at two different time points after siRNA transfection. The locations of the CpGs relative to the Alb1 or Gata1 start site are shown at the left. The percentage of plasmid clones that exhibited CpG methylation at each position in the bisulfite sequencing analysis is indicated, along with the number of methylated clones and the total number of clones analyzed (presented as a ratio). Methylation levels are represented in a gradation of colors: 0%–20% (dark green), 21%–40% (light green), 41%–60% (yellow), 61%–80% (orange), and 81%–100% (red). (D) FoxD3 and FoxA1 were overexpressed in day 14.5 MEFs by retroviral transduction. Both proteins were expressed with a Flag epitope at their C terminus. MEFs were also transduced with a control retrovirus containing an EGFP cDNA. The expression of FoxD3 and FoxA1 proteins was monitored by Western blot using an anti-Flag antibody. (E) Foxd3 and Foxa1 mRNA levels were monitored by real-time RT–PCR in uninfected ES cells, day 14.5 MEFs, and hepatocytes, as well as day 14.5 MEFs transduced with a control retrovirus or retroviruses containing Foxd3 or Foxa1 expression cassettes. (F) Bisulfite sequencing was used to examine DNA methylation at the Alb1 enhancer in untransduced MEFs and in MEFs transduced with a control retrovirus or retroviruses expressing FoxD3 or FoxA1. Results obtained with CCE ES cells are shown for comparison. (G) The sequence of the Alb1 enhancer (−10,566 to −10,895) is shown. Known transcription factor-binding sites are marked above the sequence, and CpGs are underlined.

