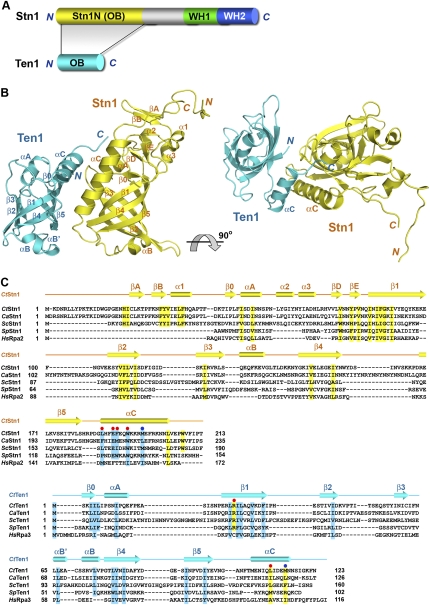
Figure 3.
Overview of the C. tropicalis Stn1N–Ten1 complex structure. (A) Domain organization of the Stn1 and Ten1 polypeptide chains. In Stn1, the N-terminal OB fold is colored in yellow, the middle linker region is shown in gray, and the two C-terminal WH motifs are shown in green and blue, respectively. Ten1 is colored in cyan. The shaded area between Stn1 and Ten1 indicates that the Stn1–Ten1 interaction is mediated by the two OB folds of the proteins. (B) Ribbon diagram of two orthogonal views of the Stn1N–Ten1 complex. Stn1N and Ten1 are colored in yellow and cyan, respectively. The secondary structure elements are labeled. The Stn1N–Ten1 complex at right is rotated by 90° about a horizontal axis relative to the complex at left. (C) Amino acid sequence alignment of Stn1N and Ten1. (Top panel) Sequence alignment of the N-terminal OB fold regions of the budding yeast Stn1 family members together with the OB folds of S. pombe Stn1 and human Rpa2. (Bottom panel) Sequence alignment of the budding yeast Ten1 family members together with S. pombe Ten1 and human Rpa3. The alignments with Rpa2 and Rpa3 are based on the crystal structure of the Rpa2N–Rpa3 complex (Bochkarev et al. 1999). Secondary structure assignments from our Stn1N–ten1 crystal structure are shown as colored cylinders (α helices) and arrows (β strands) above the aligned sequences. Red dots denote the C. tropicalis residues important for the Stn1N–ten1 interaction in the yeast two-hybrid assay, whereas blue dots denote the less important residues. Conserved hydrophobic residues in Stn1N/Rpa2N and Ten1/Rpa3 are highlighted in yellow and cyan, respectively.

