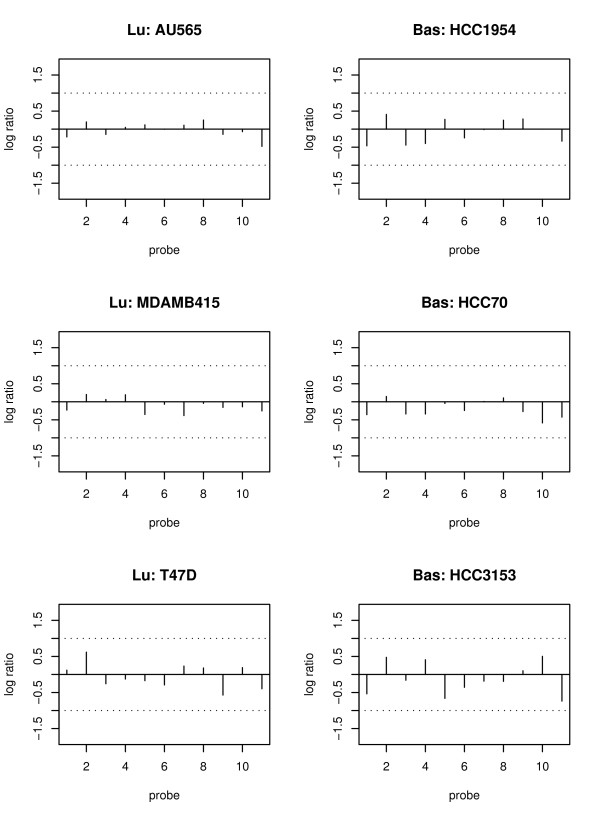
Figure 8.
The normalized data of the housekeeping gene RAD9A. The normalized data of 11 probes at one CGI (associated with RAD9A gene) for 6 cell lines. The left three plots with "Lu:" in the title of each plot are for luminal cell lines. The right three plots with "Bas:" in the title of each plot are for basal-like cell lines. The y-axis is the log ratio of methylation signals at each probe. The x-axis is the probe index at each CGI. Probes are ordered according to their physical locations, and the distance between two consecutive probes is roughly 50 bp.

