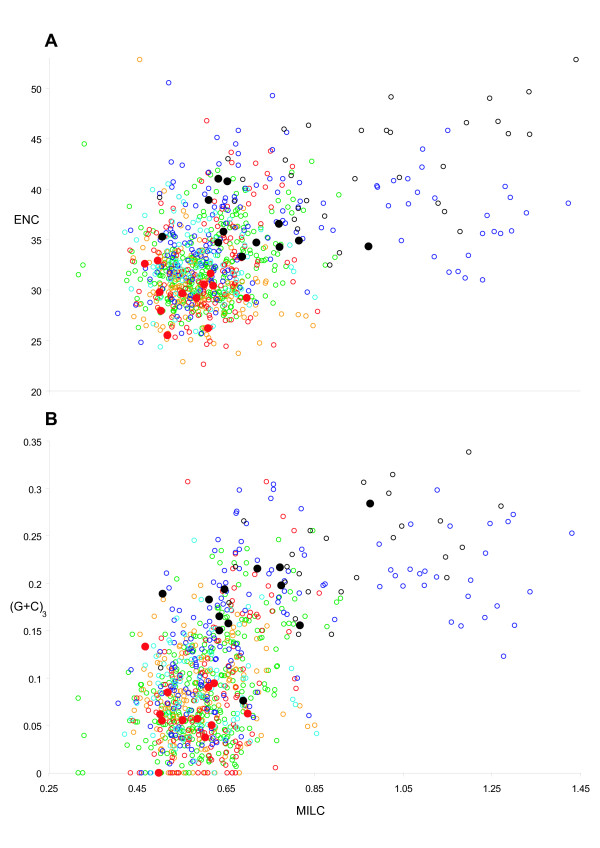
Figure 6.
Evaluation of codon bias across Holometabola. A) Codon bias in M. australiensis (red filled circle) and X. vesparum (black filled circle) measured using ENC and MILC indices (described in methods), are compared against remaining Holometabola, whose data points are given as empty circles: the colour scheme follows taxonomic group as in Figure 3 and 4. Data points refer to individual PCGs. B) MILC values are compared against (G+C)3: which is G+C content at the 3rd codon position of each PCG. This serves as an approximate measure of background nucleotide composition across individual PCGs.

