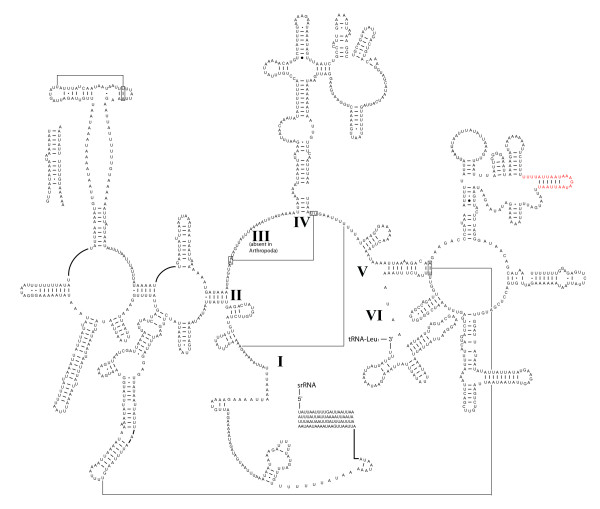
Figure 7.
Predicted secondary structure of the rrnL in M. australiensis. Regions in red receive little comparative support and remain ambiguous. Canonical A-U and G-C base pairings are given as '-'. G-U, G-A, and other non-canonical bp combinations are denoted as, '•', '○' and '●' respectively. Predicted tertiary interactions are represented by a line. Missing data are coded as 'N'.

