
Figure 3. Mitochondria in atrium of type 2 diabetic patients display high levels of mitochondrial H2O2 emission while oxidizing carbohydrate- and lipid-based substrates.
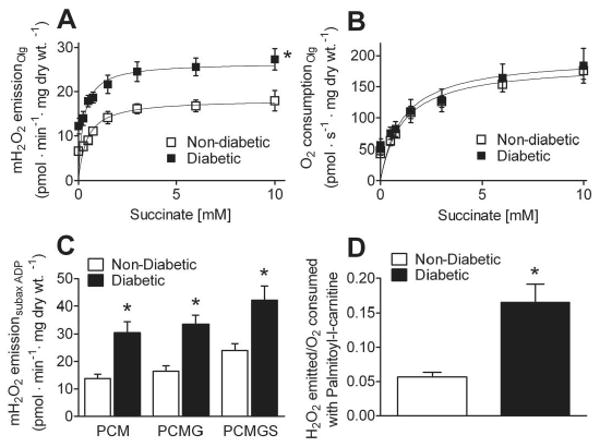
A, Kinetic plots of mitochondrial H2O2 emission and (B) O2 consumption in permeabilized atrial myofibers prepared from Diabetic and Non-Diabetic patients supported by incrementally increasing concentrations of succinate in the presence of 10 μg/ml of oligomycin (to inhibit ATPase and ensure basal respiratory state) + 5 mM glutamate, 2 mM malate. C, Quantified rates of mitochondrial H2O2 emission during respiration in the presence of 125 μM ADP, 5 mM glucose, 1 U/ml hexokinase (to create permanent, submaximally phosphorylating respiratory state), supported by 75μM palmitol-L-carnitine + 2 mM malate (PCM), 5 mM glutamate (PCMG) and 10 mM succinate (PCMGS). D, Ratio of moles of H2O2 emitted per mole of O2 consumed during respiration supported by palmitoyl-L-carnitine. Quantified data are means ± S.E.M, N = 7-9 patients in each group. * P < 0.05 vs Non-Diabetic.