
Fig. 3.
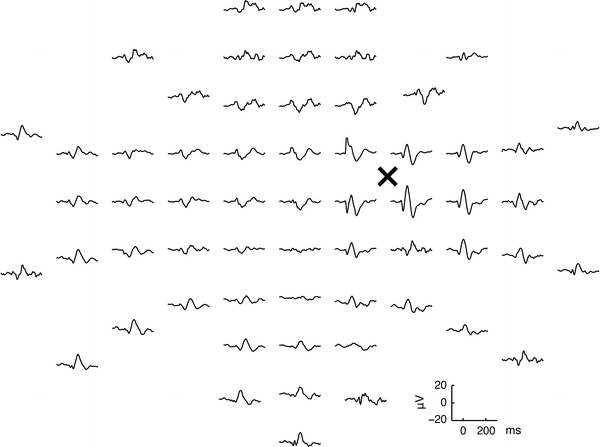
Averaged responses evoked by TMS in one subject. The signals are arranged according to the layout of the electrodes (the view is from the top of the head, nose pointing upward). Prominent response amplitudes at latencies of approximately 50–100 ms are dominant in the vicinity of the stimulated point (denoted with ‘×’). Note the lateralization of responses: in the vicinity of the stimulated site, the amplitudes are the highest, attenuating with increasing distance from the coil