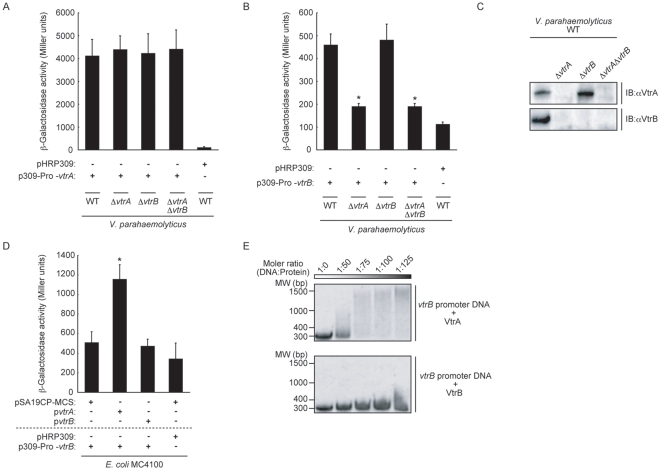
Figure 3. VtrB expression is under the control of VtrA.
A. Neither vtrA nor vtrB was involved in the transcription of vtrA. V. parahaemolyticus strains carrying the vtrA-lacZ transcriptional fusion vector were assayed for β-galactosidase activity. The bars show the average of three separate experiments, and the standard deviations are indicated by error bars. B. Transcription of vtrB was decreased in vtrA deletion strains. V. parahaemolyticus strains carrying the vtrB-lacZ transcriptional fusion vector were assayed for β-galactosidase activity. The bars show the average of three separate experiments, and the standard deviations are indicated by error bars. C. Deletion of vtrA caused a decrease in the production of VtrB. Immunoblot analysis of VtrA and VtrB protein expression in vtrA and vtrB mutant strains are shown. Lane 1, wild-type V. parahaemolyticus (WT); lane 2, vtrA mutant strain (WTΔvtrA); lane 3, vtrB mutant strain (WTΔvtrB); lane 4, vtrA and vtrB double mutant strain (WTΔvtrAΔvtrB). Blots were probed with anti-VtrA (upper panel) and anti-VtrB (lower panel) polyclonal antibodies. D. Effects of vtrA and vtrB expression on vtrB transcription in E. coli. E. coli MC4100 carrying vtrB-lacZ transcriptional fusion vector were assayed for β-galactosidase activity. The bars show the average of three separate experiments, and the standard deviations are indicated by error bars. E. Binding of purified VtrA DNA binding domain to the upstream region of vtrB is shown by an electrophoretic mobility shift assay. Each lane contains the same amount of upstream region of vtrB (30 nM) and various concentrations (0, 1.5, 2.25, 3.0, 4 µM) of VtrA DNA binding domain (upper panel) or VtrB DNA binding domain (lower panel). The molecular ratios are indicated in the top line.

