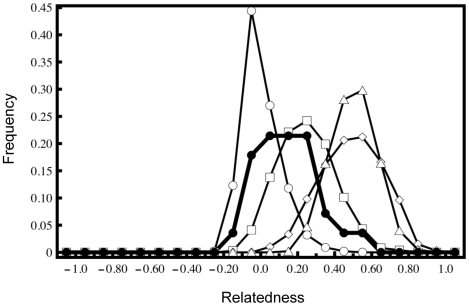
Figure 3. Relatedness structure of captive individuals of Floreana mixed ancestry.
Distribution of observed Lynch and Ritland's [36] relatedness values calculated for CDRS individuals of detected Floreana ancestry (•) overlaid upon those calculated from 1000 simulated unrelated (○), half-sibling (□), full-sibling (△), and parent-offspring (◊) dyads.

