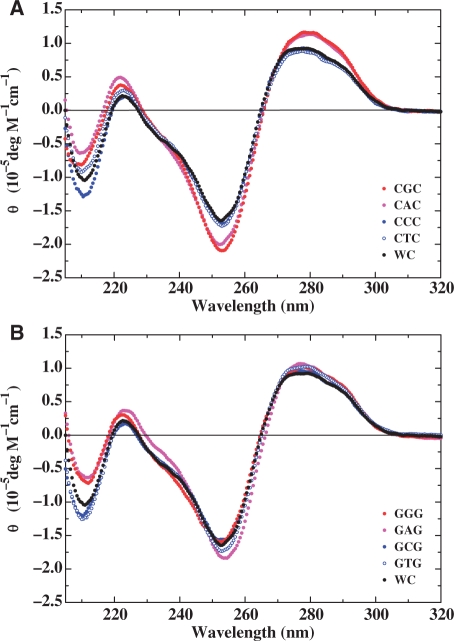
Figure 3.
Comparison of normalized circular dichroism spectra for the CNC (A) and GN′G (B) heteroduplexes relative to the parent dodecamer (hereby designated as WC). The designations for each of the heteroduplexes are depicted in the respective panels and the spectra are expressed in the form of molar ellipticity. The spectrum of the parent dodecamer (Black) is presented in each panel to assess the impact of a specific base bulge embedded within CNC and GN′G contexts.

