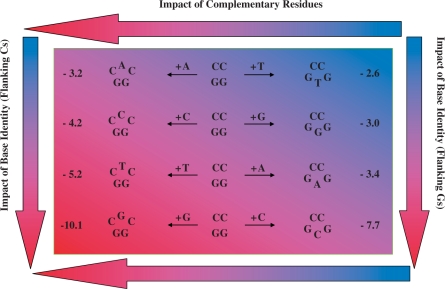
Figure 6.
Schematic representation of a two-dimensional energy gradient resolving the contributions of base identity and flanking residue to bulge-induced destabilization. The eight heteroduplexes are arranged according to the ‘complementarity’ of each bulge base (e.g. CAC/GG versus CC/GTG) within a two-dimensional energy panel that resolves the bulge-induced impacts of base identity and complementary residues in terms of destabilization energies (ΔΔG) relative to the parent dodecamer. Inspection of the trends reveals that a bulge base flanked by Cs is more destabilizing than its corresponding complementary counterpart flanked by Gs, irrespective of whether the bulge base is a purine or pyrimidine. The asymmetry of the resultant heteroduplex invariably favors GNG versus CNC bulges regardless of the absolute destabilization magnitudes. The color-coding scheme illustrates the two-dimensional energy gradient, ranking bulge-induced impacts from least (Light Blue) to most (Dark Red) destabilizing. The horizontal and vertical arrows highlight the degree of destabilization that may be attributed to the impact of complementary residues within the upper and lower strands versus a particular bulge base embedded within identical neighbors, respectively. Spanning the energy gradient from the upper right (CC/GTG) to the lower left (CGC/GG), one observes a two-dimensional ranking with a gradual increase in ΔΔG from –2.6 to –10.1 kcal/mol.

