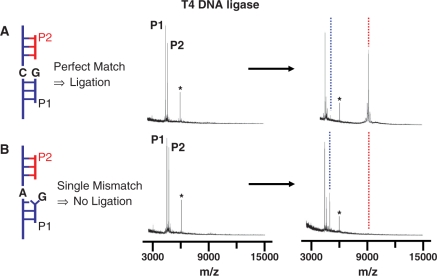
Figure 2.
Representative mass spectra showing that the SAMDI technique can identify the intermediates and products of a ligation reaction. Spectra are shown before and after the ligase reaction for a monolayer that presents (A) a substrate having a C:G matched base pair at the nick site and (B) a substrate having a A:G mismatched base pair at the nick site. In the former, the peak for the P2 probe strand (which is present in limiting quantity) gives rise to a peak representing the ligated product. For the mismatched strand, the peak for the P2 probe strand gives rise to a peak representing the adenylated probe strand, but not a ligated product. In the base pair notation X:Y, X refers to the target nucleotide and Y is the probe nucleotide. The star symbol (*) indicates the peak corresponding to the 20-mer DNA strand used for calibrating the mass range. The dotted blue and red lines indicate adenylated and ligated product, respectively.

