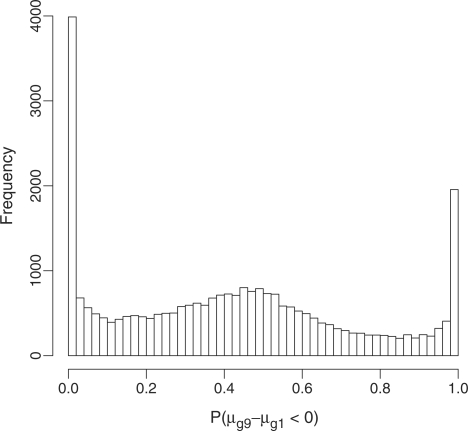
Figure 5.
Histogram of the probability that the expression value of a transcript is greater in the pure brain sample than in the pure heart sample. The two peaks at 0 and 1 capture the brain- and heart-expressed transcripts, respectively, while the hump in the centre represents genes that are expressed equally in both tissues.

