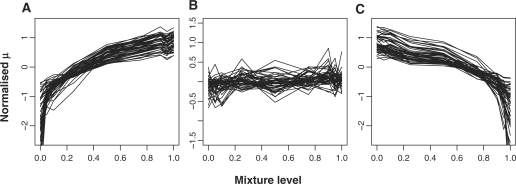
Figure 6.
Plots showing MMBGX log expression values of three types of genes at different brain/heart mixture levels. Fifty transcripts for which P(μg9−μg1 < 0) = 0, P(μg9−μg1 < 0) = 1 and 0.45 < P(μg9−μg1 < 0) < 0.55) were randomly chosen and defined as ‘brain-expressed’, ‘heart-expressed’ and ‘equally-expressed’. The group mean of the nine mixture levels was subtracted from the nine values for each group of fifty transcripts and plotted (A–C). As expected, the intensities of (A) brain-, (B) equally and (C) heart-expressed transcripts are upward-sloping, flat and downward-sloping respectively, showing that MMBGX is adequately capturing concentration changes.

