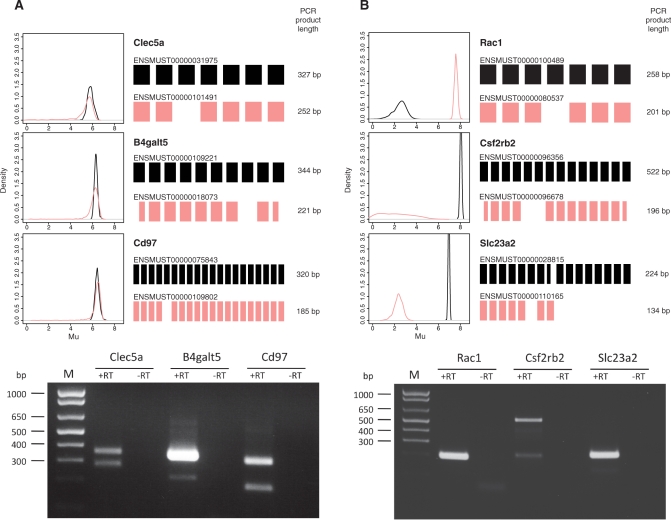
Figure 8.
Verification of isoform-level predictions by RT-PCR. Two groups of genes from mouse Exon array data were selected for validation by RT-PCR. For each gene the posterior density of the log expression parameter, μ, the exonic structure for two isoforms (not to scale) and length of the corresponding PCR products are shown. Black: full length isoform, pink: spliced isoform. Below, agarose gels of RT-PCR products are shown. RT-PCR was repeated at least three times and a representative gel is shown. (A) Genes with two isoforms with a mean log expression value greater than 6 in one of the conditions. Both isoforms can be detected for all three genes. (B) Genes with two transcripts with a difference in mean log expression of at least 5.5 between the isoforms in one of the conditions. The isoforms that were predicted to have higher expression levels were correctly identified as shown by RT-PCR.

