
Table 1.
MMBGX results for all the Ensembl transcripts targeted by the RT-PCR experiments for which gel images are available in Gardina et al.
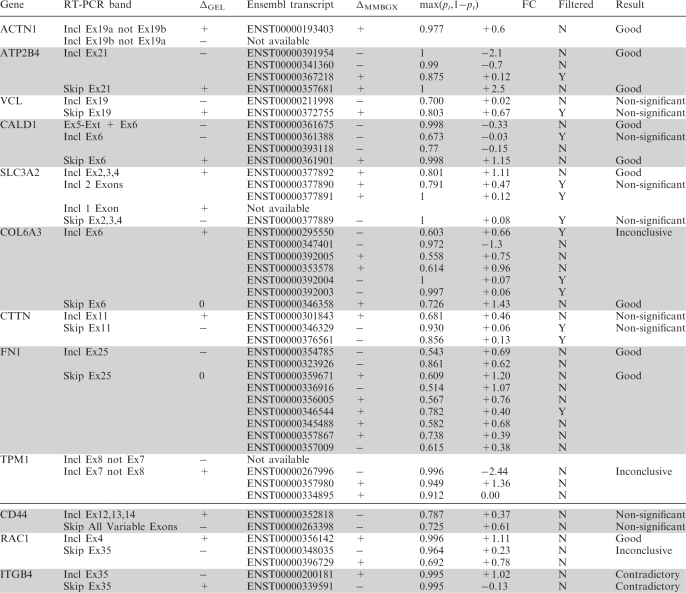 |
For each gene, two or more gel bands are listed. Each band matches a set of Ensembl transcripts for which various MMBGX results are shown. The fourth column shows whether there is agreement in the relative direction of change in transcript use between MMBGX and the gel image. The fifth column gives the probability of differential transcript use, while the sixth column gives the fold change for each transcript. Transcripts with predicted expression close to zero in both conditions are marked as filtered. The concordance between the MMBGX results and the RT-PCR validation is shown in the right-most column. Genes above the thick line were significant in the Gardina workflow, while genes below it were not.