Figure 5.
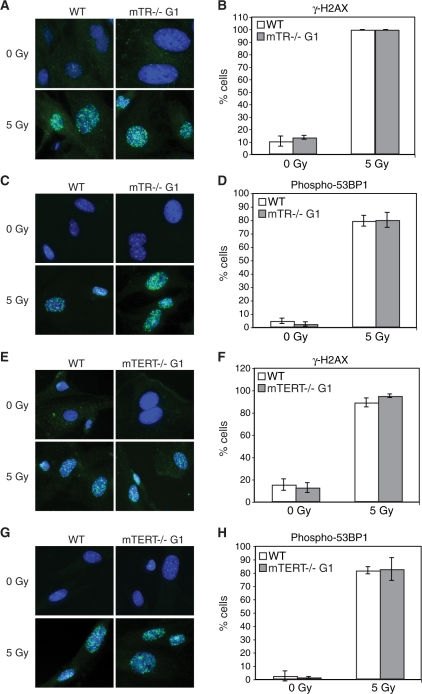
Gamma irradiation induces accumulation of γ-H2AX and phospho-53BP1 foci in wild-type, mTR–/– G1 and mTERT–/– G1 MEFs. The accumulation of γ-H2AX and phospho-53BP1 foci in untreated (0 Gy) and cells treated with 5 Gy gamma rays (5 Gy) was visualized using immunofluorescence. Representative images of each protein and cell line are shown. Quantitative graphs show the fraction of cells that accumulated >10 foci. Graphs show the arithmetic mean and SEM for three replicate experiments. (A) Immunofluorescence detects gamma ray-induced γ-H2AX foci in wild-type and mTR–/– G1 MEFs. (B) Quantification of cells with >10 γ-H2AX foci: wild-type 0 Gy compared to mTR–/– G1 0 Gy, P = 0.43; wild-type 5 Gy compared to mTR–/– G1 5 Gy, P = 1; wild-type 0 Gy compared to wild-type 5 Gy, P = 0.0006; mTR–/– G1 0 Gy compared to mTR–/– G1 5 Gy, P = 0.0007. (C) Immunofluorescence detects gamma ray-induced phospho-53BP1 foci in wild-type and mTR–/– G1 MEFs. (D) Quantification of cells with >10 phospho-53BP1 foci: wild-type 0 Gy compared to mTR–/– G1 0 Gy, P = 0.12; wild-type 5 Gy compared to mTR–/– G1 5 Gy, P = 0.9; wild-type 0 Gy compared to wild-type 5 Gy, P = 0.002; mTR–/– G1 0 Gy compared to mTR–/– G1 5 Gy, P = 0.003. (E) Immunofluorescence detects gamma ray-induced γ-H2AX foci in wild-type and mTERT–/– G1 MEFs. (F) Quantification of cells with >10 γ-H2AX foci: wild-type 0 Gy compared to mTERT–/– G1 0 Gy, P = 0.58; wild-type 5 Gy compared to mTERT–/– G1 5 Gy, P = 0.15; wild-type 0 Gy compared to wild-type 5 Gy, P = 0.005; mTERT–/– G1 0 Gy compared to mTERT–/– G1 5 Gy, P = 0.002. (G) Immunofluorescence detects gamma ray-induced phospho-53BP1 foci in wild-type and mTERT–/– G1 MEFs. (H) Quantification of cells with >10 phospho-53BP1 foci: wild-type 0 Gy compared to mTERT–/– G1 0 Gy, P = 0.67; wild-type 5 Gy compared to mTERT–/– G1 5 Gy, P = 0.89; wild-type 0 Gy compared to wild-type 5 Gy, P = 0.002; mTERT–/– G1 0 Gy compared to mTERT–/– G1 5 Gy, P = 0.04.

