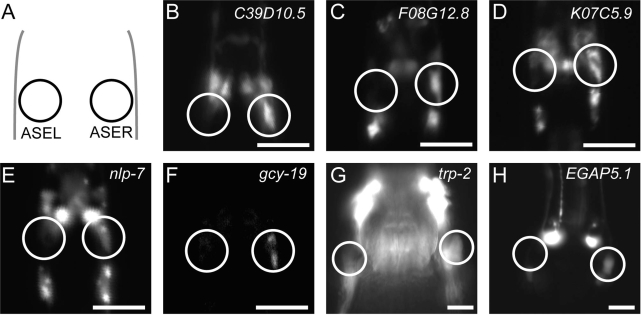
Figure 2.
Representative fluorescence images for novel ASER-biased genes. (A) Schematic depiction of the locations of ASE neurons. Circles indicate the ASEL and ASER neurons. (B–H) Transgenic animals carrying promoter-fused Venus reporter genes. Animals at the L1 stage (B–F) and the adult stage (G, H) are shown. Scale bar = 10 µm.

