
Table 4.
Use of alternative 5′ splice sites in first introns with significant changes in nuclear cap-binding complex mutants
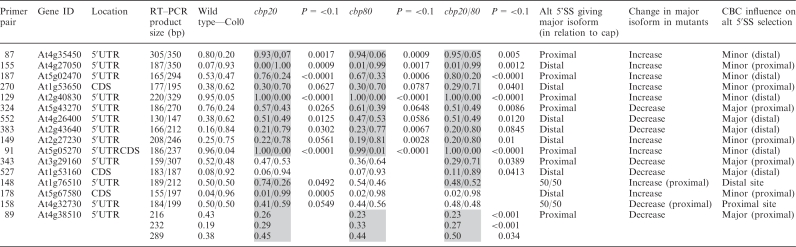 |
The relative abundance of alternatively spliced isoforms is presented as a ratio of the two products for wild type, for the single mutants cbp20 and cbp80, and for the double mutant cbp20cbp80 (cbp20/80). Significant changes between the wild type and mutants is measured at P ≤ 0.10. Only comparisons which show significant changes from wild type are presented with a P-value and are shaded grey. CDS—coding sequence; 5′UTR—5′ untranslated region; 3′UTR—3′ untranslated region.