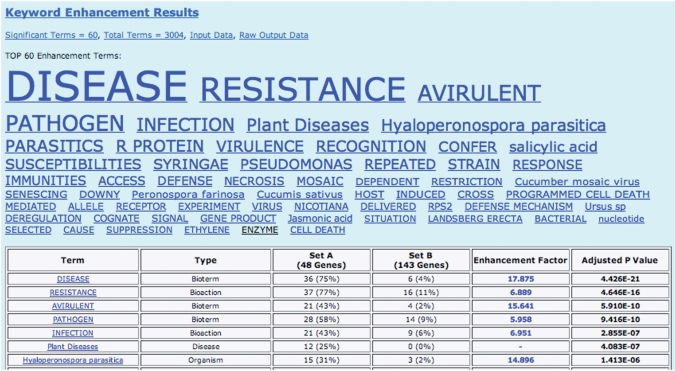
Figure 1.
Martini keyword output for the Arabidopsis dataset. All significantly enhanced keywords are shown first as a ‘keyword cloud’, where the size of each keyword is proportional to its statistical significance. The keywords assigned to input sets A or B are colored blue or black, respectively. Below the keyword cloud, the significant keywords are shown again in a table form, including: the number of times each keyword occurs in each set; the enhancement factor (i.e. the ratio of the previous numbers); finally, the table gives an adjusted p-value, which is an estimation of the likelihood that the given level of keyword enhancement occurred by chance. Note that the total number of genes or abstracts shown in this table may be slightly less than the number in the user-defined input. This may happen for two reasons: first, depending on the user’s choice of genes or abstracts as input, Martini will remove common items; secondly, some abstracts may not have been indexed in AKS2, and hence they are not counted.

