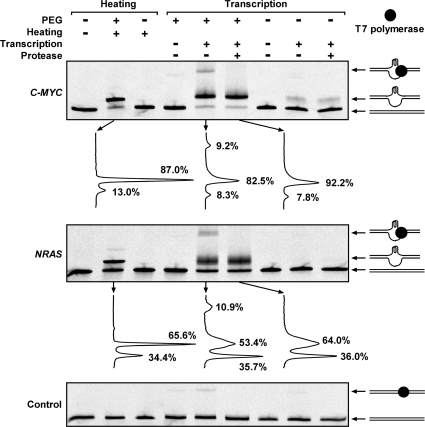
Figure 2.
G-quadruplex formation in long dsDNA carrying G-quadruplex-forming sequence from the C-MYC, NRAS gene examined by native gel electrophoresis. DNAs, including the control that does not form G-quadruplex, were labeled at the 5′-end of the G-rich strand with a FAM and subjected either to RNA transcription or heat denaturation/denaturation as described in Figure 1. The samples marked as transcription negative were treated in the same way as the transcription positive samples except that no NTP was supplied. The drawing at the right side shows schematic illustration of the DNA structure associated with the indicated DNA band. The graph beneath the C-MYC and NRAS gel is the digital scan of the indicated lane to quantitate the percentage of each DNA band.

