
Figure 6.
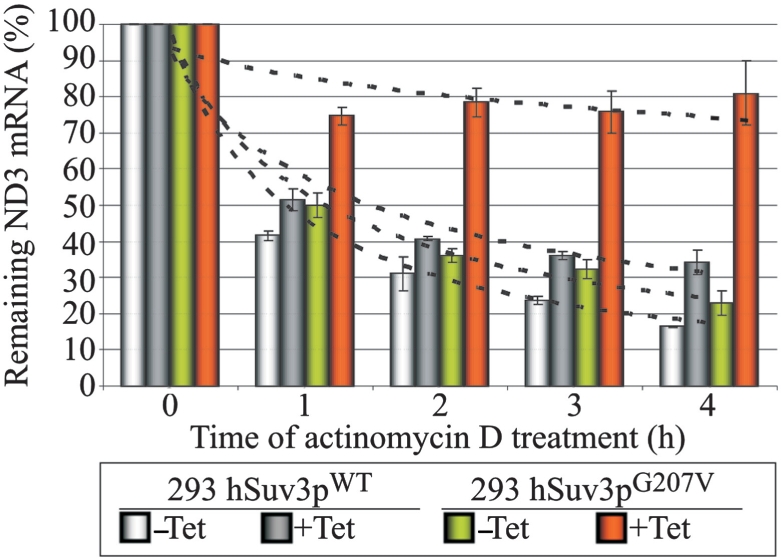
Impairment of hSuv3p function results in ND3 mRNA stabilization. Graph representing the level of ND3 mRNA measured by northern blot in cells untreated (point 0) and treated with the transcription inhibitor actinomycin D. Cells uninduced (–Tet) and induced (+Tet) for 24 h were analyzed. The results represent the mean of three independent experiments, error bars represent standard deviation, trend lines are also marked (dashed lines).