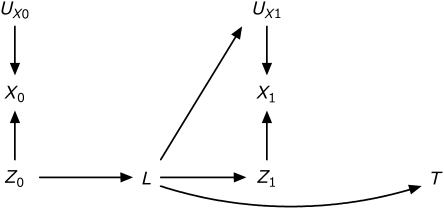
Appendix Figure 1.
Causal diagram depicting simulation data. T is time to acquired immunodeficiency syndrome or death, Zj is the true exposure to highly active antiretroviral therapy for j = {0,1}, Xj is the measured exposure to highly active antiretroviral therapy, L are the time-varying confounders, and U are unmeasured determinants of the subscripted variable.

