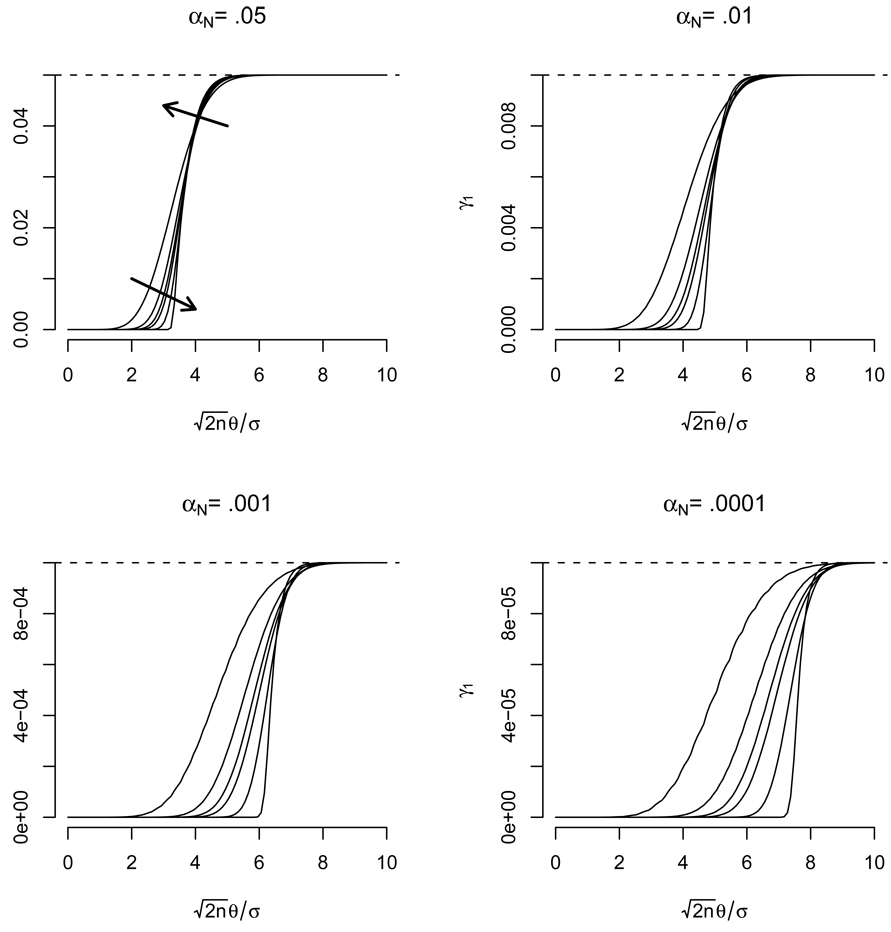
Figure 1.
The true error rate, γ1, for a TOST test performed when Δμ = 1θ plotted as a function of . Each line represents a different sample size with n = 5, 10, 15, 20, 50, 1000 while each plot considers a different nominal error rate. The arrows point in the direction of increasing n. Dashed reference lines at the nominal error rate are drawn.

