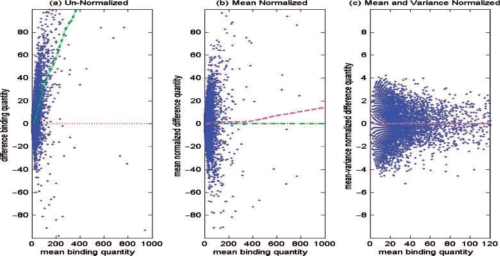
Fig. 2.
An example of the normalization process applied to the binding quantity difference between MCF7 control and MCF7 + E2 breast cancer data on Chromosome 1. (a) Raw data with clear bias towards the positive direction; (b) data normalized with respect to the mean; (c) data normalized with respect to both mean and variance (x-axis is zoomed-in). Green (dash-dot) and magenta (dashed) lines represent the LOESS smoother line with respect to the mean and variance, respectively. Red (dotted) line represents the zero-difference line. For color version of the figure see Bioinformatics online.

