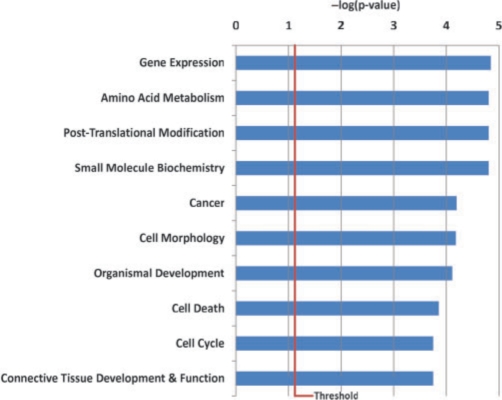
Fig. 4.
top 10 functional groups identified by IPA for the 100 highly connected genes that show decreased Pol II binding quantities in OHT cells but not in E2-treated MCF7 cells. The blue bar indicates the minus logarithm (base 10) of the P-values for the Fisher's exact test. The threshold line indicating P < 0.05. For color version of the figure see Bioinformatics online.

