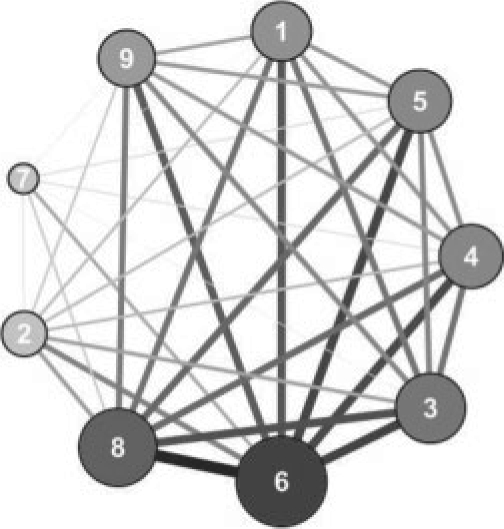
Fig. 1.
Gene module interaction network. Interactions among the nine gene modules are visualized according to the C matrix. The nodes represent modules and the edges indicating the strength of the interaction between modules. A higher Ci,j value in the C matrix, suggesting stronger interaction, is indicated by a thicker and darker edge line, whereas a higher ‘sum’ value in the C matrix, suggesting more relevant module, is indicated by a larger and darker node.

