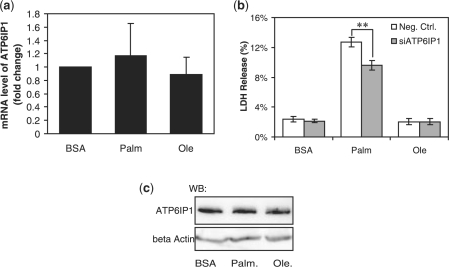
Fig. 3.
Effects of the fatty acids on the expression level of ATP6IP1 and the role of ATP6IP1 in cytotoxicity. HepG2 cells were exposed to 0.7 mM palmitate or oleate for 24 h (a and c). After treatment, the cells were harvested, and RT-PCR (a) and western blot analysis (c) were performed to detect the mRNA (a) and the protein (c) expression levels of ATP6IP1. Reverse transfection of suspended HepG2 cells were performed with scrambled siRNA (white bar, negative control) or siRNA of ATP6IP1 (gray bar, siATP6IP1) for 24 h and the transfected cells were then cultured in 0.7 mM palmitate or oleate for another 24 h (b). Cells were then harvested, and the LDH release was assayed (b). Data expressed as average of nine samples ±SD from three independent experiments. Student's t-test was used to analyze the differences between treatment groups. **Significantly lower than negative control, i.e. scrambled siRNA, P < 0.01.

